CASE STUDIES
Real brands, real lifts
Media & Content Commerce

$235K Annualized GMV Uplift From Existing Traffic Monetization
~$235K
Annualized GMV uplift
+10%
CVR lift
-15% lower blended CAC from existing traffic
Media & Content Commerce
~$235K
Annualized GMV uplift
+10%
CVR lift
-15% lower blended CAC from existing traffic
Media & Content Commerce
~$235K
Annualized GMV uplift
+10%
CVR lift
-15% lower blended CAC from existing traffic
Health & Wellness

$600K+ Hidden Revenue Identified Across a DTC Nutrition Funnel
$600K+
Annualized revenue at risk
5
Systemic conversion leaks
$1M+ upside as fixes scale across templates
Health & Wellness
$600K+
Annualized revenue at risk
5
Systemic conversion leaks
$1M+ upside as fixes scale across templates
Health & Wellness
$600K+
Annualized revenue at risk
5
Systemic conversion leaks
$1M+ upside as fixes scale across templates
Electronics & Technology

+$90K Annualized Incremental Revenue From Mobile Decision Clarity
+$90K
Annualized incremental revenue
+12%
Add-to-cart lift
-15% blended CAC reduction
Electronics & Technology
+$90K
Annualized incremental revenue
+12%
Add-to-cart lift
-15% blended CAC reduction
Electronics & Technology
+$90K
Annualized incremental revenue
+12%
Add-to-cart lift
-15% blended CAC reduction
Home & Living

$181K Annualized Revenue Recapture From Purchase Path Clarity
$181K
Annualized revenue recapture
~15.6%
ATC-to-purchase conversion rate
~$333 average order value
Home & Living
$181K
Annualized revenue recapture
~15.6%
ATC-to-purchase conversion rate
~$333 average order value
Home & Living
$181K
Annualized revenue recapture
~15.6%
ATC-to-purchase conversion rate
~$333 average order value
Beauty & Personal Care

+13% Conversion Rate Lift From Social-First Beauty Funnel Sequencing
+13%
Conversion rate lift
+9%
Top-line revenue growth
-15% blended CAC reduction
Beauty & Personal Care
+13%
Conversion rate lift
+9%
Top-line revenue growth
-15% blended CAC reduction
Fashion & Lifestyle
.jpg)
$365K+ Annualized GMV Opportunity From Action Sports Funnel Improvements
$365K+
Annualized GMV opportunity
+11%
Top-line revenue lift
-17% blended CAC reduction
Fashion & Lifestyle
$365K+
Annualized GMV opportunity
+11%
Top-line revenue lift
-17% blended CAC reduction
Fashion & Lifestyle
$365K+
Annualized GMV opportunity
+11%
Top-line revenue lift
-17% blended CAC reduction
Fashion & Lifestyle

$140K Expected Annualized GMV Uplift From Mobile Shopping Path Improvements
$140K
Expected annualized GMV uplift
$200K+
Upside annualized GMV
100% existing traffic, no acquisition lift required
Fashion & Lifestyle
$140K
Expected annualized GMV uplift
$200K+
Upside annualized GMV
100% existing traffic, no acquisition lift required
Fashion & Lifestyle
$140K
Expected annualized GMV uplift
$200K+
Upside annualized GMV
100% existing traffic, no acquisition lift required
Home & Living

$55K Expected Annual Uplift From Home Décor Purchase Path Clarity
$55K
Expected annual uplift
+33%
Add-to-cart lift
100% driven by existing traffic
Home & Living
$55K
Expected annual uplift
+33%
Add-to-cart lift
100% driven by existing traffic
Fashion & Lifestyle

$20.5K Expected Annual Incremental Revenue From Funnel Clarity
$20.5K
Expected annual incremental revenue
+50%
Modeled lift vs current run rate
30+ additional testable opportunities identified
Fashion & Lifestyle
$20.5K
Expected annual incremental revenue
+50%
Modeled lift vs current run rate
30+ additional testable opportunities identified
Fashion & Lifestyle
$20.5K
Expected annual incremental revenue
+50%
Modeled lift vs current run rate
30+ additional testable opportunities identified
B2B & Wholesale
$1.7M Modeled Annualized Revenue Opportunity From Wholesale Purchase Path Improvements
$1.7M
Modeled annualized revenue opportunity
300%
Projected annualized ROI
-10% blended CAC reduction
B2B & Wholesale
$1.7M
Modeled annualized revenue opportunity
300%
Projected annualized ROI
-10% blended CAC reduction
B2B & Wholesale
$1.7M
Modeled annualized revenue opportunity
300%
Projected annualized ROI
-10% blended CAC reduction
Food & Beverage

$924K Projected Annualized Revenue Uplift From Product Discovery Improvements
$924K
Projected annualized revenue uplift
+12%
Add-to-cart rate lift
~1M sessions analyzed
Food & Beverage
$924K
Projected annualized revenue uplift
+12%
Add-to-cart rate lift
~1M sessions analyzed
Food & Beverage
$924K
Projected annualized revenue uplift
+12%
Add-to-cart rate lift
~1M sessions analyzed
Fashion & Lifestyle
+13% Conversion Rate Lift Across Global Activewear Markets
+13%
Conversion rate lift
+10%
Top-line revenue growth
4 regional markets impacted
Fashion & Lifestyle
+13%
Conversion rate lift
+10%
Top-line revenue growth
4 regional markets impacted
Fashion & Lifestyle

$330K Modeled Incremental Annual Revenue From On-Site Revenue Capture
$330K
Modeled incremental annual revenue
$245K+
PLP revenue opportunity
0 incremental media spend required
Fashion & Lifestyle
$330K
Modeled incremental annual revenue
$245K+
PLP revenue opportunity
0 incremental media spend required
Fashion & Lifestyle
$330K
Modeled incremental annual revenue
$245K+
PLP revenue opportunity
0 incremental media spend required
Media & Content Commerce

$400K Expected Annualized GMV Upside From Kitchen Commerce Optimization
$400K
Expected annualized GMV upside
9
Diagnostic-backed experiments
9 diagnostic-backed experiments deployed
Media & Content Commerce
$400K
Expected annualized GMV upside
9
Diagnostic-backed experiments
9 diagnostic-backed experiments deployed
Media & Content Commerce
$400K
Expected annualized GMV upside
9
Diagnostic-backed experiments
9 diagnostic-backed experiments deployed
Marketplace & Resale
$864K Expected Annual Revenue Recapture From Restoring Shoppability
$864K
Expected annual revenue recapture
100%
Existing traffic driven
100% driven by existing traffic
Marketplace & Resale
$864K
Expected annual revenue recapture
100%
Existing traffic driven
100% driven by existing traffic
Marketplace & Resale
$864K
Expected annual revenue recapture
100%
Existing traffic driven
100% driven by existing traffic
Pet

$861K Projected Annual GMV From Pet E-Commerce Decision Clarity
$861K
Projected annual GMV
+13%
Relative conversion rate lift
-15% blended CAC reduction
Pet
$861K
Projected annual GMV
+13%
Relative conversion rate lift
-15% blended CAC reduction
Automotive

375% Annualized ROI From Turning Browsing Into Buying
375%
Annualized ROI
+12%
Relative CVR lift
-13% blended CAC reduction
Automotive
375%
Annualized ROI
+12%
Relative CVR lift
-13% blended CAC reduction
Fashion & Lifestyle
$210K Annualized GMV Opportunity From Apparel Conversion Efficiency
$210K
Annualized incremental GMV
+18%
CVR relative lift
-15% blended CAC reduction
Fashion & Lifestyle
$210K
Annualized incremental GMV
+18%
CVR relative lift
-15% blended CAC reduction
Food & Beverage
Turning High Engagement Into Higher Conversion in DTC Food Commerce
97.8%
Downstream completion rate
3–5%
Purchase flow entry rate
4% commerce re-entry rate
Food & Beverage
97.8%
Downstream completion rate
3–5%
Purchase flow entry rate
4% commerce re-entry rate
Fashion & Lifestyle

$342.8K Annualized Incremental GMV From Fit-First Decision Sequencing
$342.8K
Annualized incremental GMV
+14.6%
Add-to-cart rate lift
~79% incremental impact driven by mobile sessions
Fashion & Lifestyle
$342.8K
Annualized incremental GMV
+14.6%
Add-to-cart rate lift
~79% incremental impact driven by mobile sessions
Fashion & Lifestyle
$342.8K
Annualized incremental GMV
+14.6%
Add-to-cart rate lift
~79% incremental impact driven by mobile sessions
Fashion & Lifestyle
$300K+ Expected Annual Revenue Impact From Product Decision Signal Optimization
$300K+
Expected annual revenue impact
+10%
Add-to-cart lift potential
+17% homepage engagement lift opportunity
Fashion & Lifestyle
$300K+
Expected annual revenue impact
+10%
Add-to-cart lift potential
+17% homepage engagement lift opportunity
Fashion & Lifestyle
$300K+
Expected annual revenue impact
+10%
Add-to-cart lift potential
+17% homepage engagement lift opportunity
Beauty & Personal Care

$25.7K Projected Annual Lift From Catalog Navigation Optimization
$25.7K
Projected annual revenue impact
+30%
Product discovery lift
+40% projected shopping action lift
Beauty & Personal Care
$25.7K
Projected annual revenue impact
+30%
Product discovery lift
+40% projected shopping action lift
Beauty & Personal Care
$25.7K
Projected annual revenue impact
+30%
Product discovery lift
+40% projected shopping action lift
Electronics & Technology

$120K Expected Annual GMV Increase From Device-Search Optimization
$120K
Expected annual GMV increase
+8%
Revenue growth from existing traffic
+10% homepage conversion lift
Electronics & Technology
$120K
Expected annual GMV increase
+8%
Revenue growth from existing traffic
+10% homepage conversion lift
Electronics & Technology
$120K
Expected annual GMV increase
+8%
Revenue growth from existing traffic
+10% homepage conversion lift
Fashion & Lifestyle

$170K Expected Annualized GMV From Faster Mobile Product Discovery
$170K
Expected annualized GMV impact
+25%
Homepage add-to-cart lift opportunity
+3% product discovery lift opportunity
Fashion & Lifestyle
$170K
Expected annualized GMV impact
+25%
Homepage add-to-cart lift opportunity
+3% product discovery lift opportunity
Fashion & Lifestyle
$170K
Expected annualized GMV impact
+25%
Homepage add-to-cart lift opportunity
+3% product discovery lift opportunity
Food & Beverage
$95K Expected Annual Lift From Reducing Cart Friction
$95K
Expected annual revenue lift
+3%
Add-to-cart rate lift
+35% product discovery click-through
Food & Beverage
$95K
Expected annual revenue lift
+3%
Add-to-cart rate lift
+35% product discovery click-through
Food & Beverage
$95K
Expected annual revenue lift
+3%
Add-to-cart rate lift
+35% product discovery click-through
Health & Wellness

$252K+ Projected Annual Lift From Free-Trial Funnel Optimization
$252K+
Projected annual revenue lift
+2,700
Additional trial signups/year
10% bounce rate reduction
Health & Wellness
$252K+
Projected annual revenue lift
+2,700
Additional trial signups/year
10% bounce rate reduction
Health & Wellness
$252K+
Projected annual revenue lift
+2,700
Additional trial signups/year
10% bounce rate reduction
Fashion & Lifestyle
+373% Revenue Per Session: Turning BLVCK's Brand Heat Into Shoppable Action
+373%
Revenue per session lift
~$300K+
Annualized upside
4 confirmed wins
Fashion & Lifestyle
+373%
Revenue per session lift
~$300K+
Annualized upside
4 confirmed wins
Direct to Consumer Apparel

$196K Designed Upside From Three Mobile-First Funnel Fixes
$196K
Annualized upside ceiling
72%
Mobile traffic share
$55K–$196K annualized impact
Direct to Consumer Apparel
$196K
Annualized upside ceiling
72%
Mobile traffic share
$55K–$196K annualized impact
Direct to Consumer Apparel
$196K
Annualized upside ceiling
72%
Mobile traffic share
$55K–$196K annualized impact
Loungewear & Sleepwear

$55K-$70K Annualized From One Homepage Sequencing Win
$55K-$70K
Annualized upside
+10.9%
Conversion rate lift
Gains from UX clarity
Loungewear & Sleepwear
$55K-$70K
Annualized upside
+10.9%
Conversion rate lift
Gains from UX clarity
Kitchenware & Speciality Ecommerce
~$468.8K Gross Annualized Upside From Decision-Layer CRO
~$468.8K
Gross annualized upside
+203%
RPU lift
~$418.3K net annualized
Kitchenware & Speciality Ecommerce
~$468.8K
Gross annualized upside
+203%
RPU lift
~$418.3K net annualized
Kitchenware & Speciality Ecommerce
~$468.8K
Gross annualized upside
+203%
RPU lift
~$418.3K net annualized
Food & Beverage
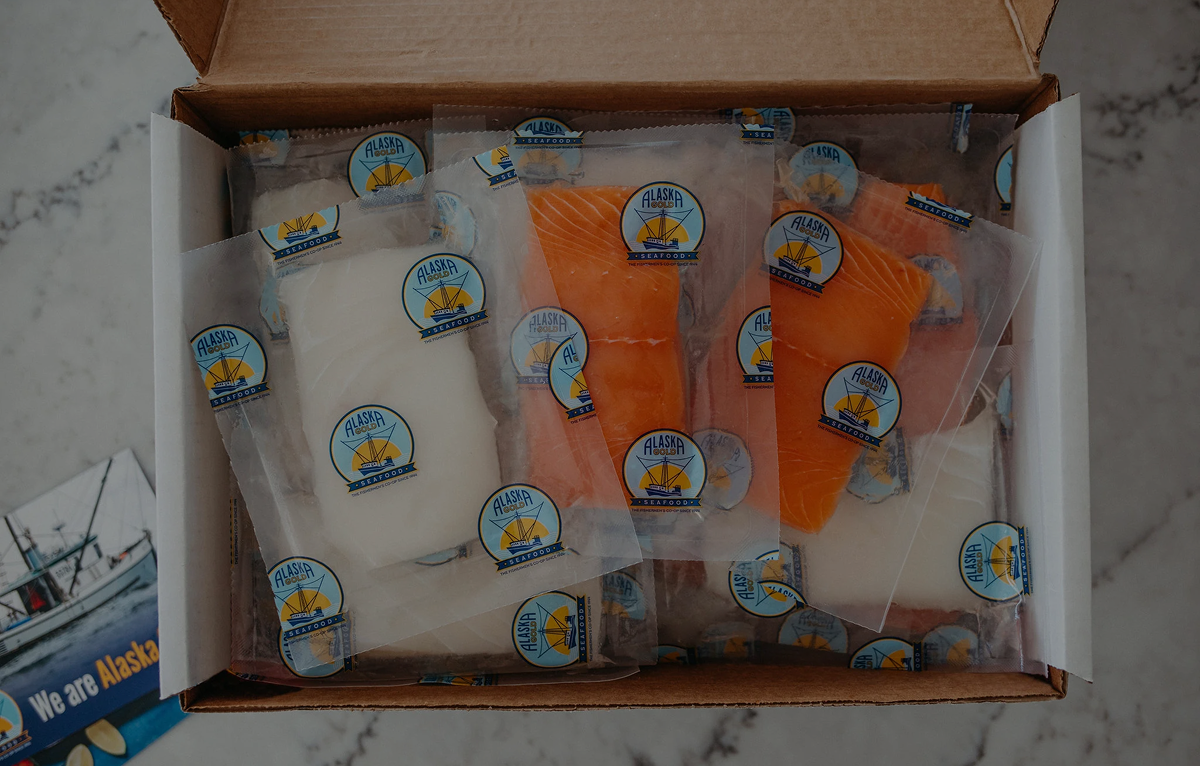
+146.9% RPU: Turning Seafood Complexity Into Buy-Area Clarity
+146.9%
RPU lift
~$316.4K
Annualized upside
+240% RPU signal
Food & Beverage
+146.9%
RPU lift
~$316.4K
Annualized upside
+240% RPU signal